- The Curious Quill
- Posts
- The Real Differentiator in Leadership
What if I told you the single most important leadership quality isn't what graces most magazine covers?
It’s not raw intellect. It’s not magnetic charisma. It's not even that polished "executive presence" we're often told to cultivate. Sure, those attributes help. Being sharp aids diagnosis; charm helps rally the troops. We've all seen leaders leverage these effectively.
But in the trenches of building and scaling businesses, especially within the dynamic, often chaotic startup ecosystem, there is a different trait needed. In the fast moving world of startups, one capability stands out: data-driven leadership.
The most effective leaders don't just know their numbers; they wield them as a sixth sense. They use data to maintain an unwavering connection to the operational truth of their business. They deliberately invest time ensuring they track the right metrics, stay attuned to the signals emerging from the noise, and masterfully blend three crucial inputs: instincts, observations, and quantitative signals.
Critically, they don't see this as an add-on or mere board reporting. They see it as core to their identity—it’s simply how they lead. This isn't about looking good; it's about being honest with themselves and their teams about what's really happening.
Introducing the Radar Loop: A System for Data-Driven Leadership
Becoming data-driven isn't some innate talent reserved for quants. It's a learnable discipline, a set of interconnected habits that form a powerful operating system. Think of it not as replacing your valuable intuition, but augmenting it—extending your perception beyond what your five senses alone can capture. Numbers become that crucial sixth sense, revealing patterns, validating hunches, and illuminating truths that might otherwise stay shrouded in the "fog of war."
To make this tangible, we can use a framework called the Radar Loop. It's designed to transform data from a passive reporting tool into an active, strategic leadership capability, creating an unfair advantage.
The Radar Loop revolves around three core, reinforcing habits:
1. Pick the vital few metrics that truly matter.
2. Share insights through simple, consistent reporting.
3. Act decisively on the patterns revealed.
When these habits compound, they create a virtuous cycle—a flywheel—that builds momentum, sharpens focus, and keeps the entire organization tethered to reality. It ensures strategy evolves proactively, informed by evidence, not just reactive adjustments when the market forces your hand.
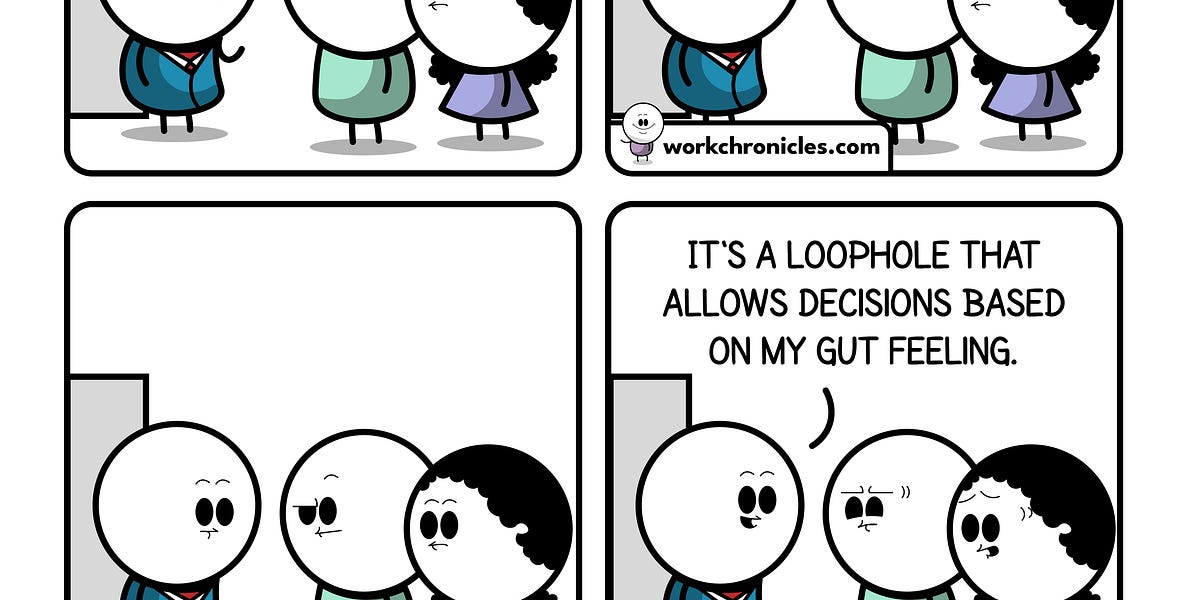
If we have data, let’s look at data. If all we have are opinions, let’s go with mine.”
Anatomy of the Radar Loop: The Three Core Habits
This isn't about drowning your team (or yourself) in endless dashboards. It's about strategic immersion in the right information at the right time. Let's dissect the three pillars:
1. Pick the Right Metrics (Curate Your "Data Diet")
Exceptional data-driven leaders are masters of focus. They understand the Pareto principle applies to metrics: a vital few often predict the vast majority of outcomes. They resist the urge to track everything and instead curate a concise "data diet." How?
Start with critical questions: What are the most crucial outcomes for the business right now? What activities most directly drive those outcomes? What are the biggest assumptions or risks in our current plan? What needs to be true for us to win?
Translate questions into metrics: Define specific, measurable indicators that directly answer those questions. Aim for a focused set – often just 3-5 key metrics reviewed weekly – providing a true pulse check.
Balance your indicators: Include a mix of:
Lagging Indicators: Measure past results (e.g., Monthly Recurring Revenue (MRR), customer churn rate, Net Promoter Score (NPS)). They confirm if you achieved the goal.
Leading Indicators: Measure activities predictive of future results (e.g., sales pipeline value created, free trial conversion rate, weekly active users, new feature adoption rate). They signal if you're on track to achieve the goal. Having strong leading indicators creates optionality – the ability to course-correct before lagging indicators turn sour.
Set a review cadence: Not everything needs daily scrutiny. Decide what requires weekly focus versus monthly or quarterly review. This prevents overwhelm and ensures meaningful attention.
The goal isn't data quantity; it's insight quality. Are you currently tracking metrics that feel like old luggage – carried around but never really opened or examined? Which ones could you prune to sharpen focus?
Data hidden away in complex spreadsheets or scattered across multiple dashboards rarely sparks action. Effective leaders borrow a concept from professional kitchens: mise en place, meaning "everything in its place." They organize key data so it's prepared, accessible, and ready for use before the strategic "cooking" begins.
Embrace radical simplicity: Focus relentlessly on the vital metrics identified in your data diet. Design reports (often a single page or dashboard view) that someone can grasp in 60 seconds. Avoid clutter that obscures the signal. Could your key report pass the "glance test"?
Establish a consistent rhythm: A regular cadence – typically weekly for operational teams, often reviewed first thing Monday morning – makes data review a predictable, ingrained habit. This isn't about adding meetings; it's about making existing check-ins (like team syncs or leadership huddles) far more productive and evidence-based.
Adopt "Less Data, More Often": Frequent, focused snapshots (like a weekly Radar Report) are usually more valuable than infrequent, overwhelming data dumps. This allows for earlier trend spotting and faster, smaller course corrections – preventing minor deviations from becoming major problems.
Think of your weekly report as the prepped ingredients for strategic conversations. It puts the right data, in the right place, at the right time, making insights easier to spot and discussions more focused. How could you apply the mise en place principle to your current reporting?
3. Act Decisively on Insights (Close the Loop)
Knowing the numbers is table stakes. Reporting them is necessary but insufficient. The real leverage comes from translating observations and insights into tangible action. This is where leadership truly crystallizes.
Connect data to identity: As Stephen Covey powerfully stated in The 4 Disciplines of Execution, the best performers see tracking and acting on key metrics not as an administrative task, but as integral to winning. > “People perform best when they are emotionally engaged; they are emotionally engaged when they are keeping score… Great teams know, at every moment, whether or not they are winning.”
Cultivate relentless curiosity: When a metric moves unexpectedly – up or down – what happens next? Data-driven leaders don't just note it; they diagnose. They ask "Why?" repeatedly. Crucially, they blend the quantitative signal ("What does the number say?") with qualitative investigation ("What are customers telling us? What are front-line teams observing?").
Maintain a bias towards action: Insight without action is intellectual indulgence. The goal isn't exhaustive analysis paralysis; it's informed decision-making and rapid iteration. Use frameworks like the DARE checklist to move swiftly:
Diagnose the root cause (combining data and observation).
Assess the potential impact if the trend continues.
Remedy by formulating a specific hypothesis and launching a focused experiment or intervention.
Evaluate the results using the same metric in the next review cycle.
Ensure accountability and learning: Close the feedback loop. Did the actions taken produce the intended effect? What did we learn? Celebrating the learning, even from failed experiments, reinforces the value of the process and builds a culture of intelligent risk-taking.
This three-part Pick -> Share -> Act cycle is the engine of the Radar Loop. It transforms inert data points into fuel for accelerated progress. Which part of this loop currently feels like the weakest link in your team's operating rhythm?
Putting the Radar Loop into Practice: From Theory to Reality
Knowing the framework is one thing; embedding it into the daily lifeblood of your organization is the real challenge. Let's explore some practical applications.
Before we go further, a crucial distinction. While we advocate for being data-driven, it's vital to avoid being data-blinded. As Andrew Chen and others have rightly pointed out, relying solely on quantitative data without context or critical thinking can lead you astray. We've all witnessed scenarios where:
Poor metrics get excused away: "Oh, that dip? Just seasonality. It'll bounce back."*
Correlation is mistaken for causation: "Our most engaged users upload a profile pic, so let's force everyone to do it!"* (Often followed by... crickets).
Conflicting metrics create paralysis: "Metric A is down, but Metric B is up... so, net-net, we're okay?"*
Action stalls indefinitely: "We need to wait for the A/B test results to reach significance..."* (Weeks later).
Hitting local optima doesn't move the needle: "We increased sign-ups by 5%, but revenue hasn't budged. Why?"*
Analysis paralysis sets in: The cost and time to analyze everything* becomes prohibitive.
Measuring yesterday inhibits tomorrow: Data reflects your current* users, who might be early adopters. Over-optimizing for them can prevent reaching a broader market that needs simplicity over niche features.
The tyranny of the majority ignores key segments: Averages obscure the behavior of vital high-value customers or strategic segments.
Some crucial factors are hard to measure: How do you quantify brand perception, team morale, or the impact on a key strategic partnership in a simple metric?
Does this invalidate the pursuit of data-driven leadership? Absolutely not. It simply highlights the need for wisdom and context. It pushes us towards being Data-Informed, not just data-driven.
Data-Ignorant: Relying purely on gut feel, anecdotes, or HIPPO (Highest Paid Person's Opinion). High risk, low repeatability.
Data-Driven: Prioritizing quantitative data, sometimes to the exclusion of qualitative insights or strategic context. Can lead to local maxima or analysis paralysis.
Data-Informed: This is often the sweet spot. Intelligently integrating quantitative data with qualitative insights (customer conversations, team observations), experience, intuition, and strategic judgment. Data is a critical input, but not the only input.
For startups, especially those competing against resource-rich incumbents, trying to win solely on incremental optimization (the typical "data-driven" playbook of large companies) can be a losing game. They often need to be data-informed, using intuition for bolder, faster strategic moves ("big swings") while leveraging data surgically for optimizing critical paths (like onboarding flows, core loops, or conversion funnels). Where does your team currently operate on this spectrum? How could becoming more consciously data-informed change your decision-making calculus?
Hiring Data-Savvy Folks: The Two-Question Litmus Test
It's easy for candidates to claim they're "data-driven." How do you cut through the buzzwords and assess genuine capability, especially for roles where this is non-negotiable? Use this focused, two-part approach:
Part 1: Measuring What Matters
"Walk me through the 3-5 most critical metrics you personally tracked on a weekly basis in your last role. What were they specifically? Why these particular metrics? And crucially, what was your exact process for reviewing them – when, how, and what signals were you looking for?"
Here, you're probing for:
Prioritization: Can they articulate the vital few amidst the noise?
Clarity & Depth: Do they understand the metric definitions, nuances, and strategic relevance?
Process Discipline: Is there evidence of a consistent, repeatable review habit, not just ad-hoc glances?
Ownership: Do they speak about the metrics as tools they actively used, not just reports they received?
Weak answers are generic ("I looked at revenue") or unfocused (a laundry list). Strong answers are concise, demonstrate understanding of leading/lagging concepts, detail the why and the how, and convey genuine ownership.
Part 2: Translating Insight into Action
> "Now, pick one of those key metrics. Tell me about a specific time you spotted a significant challenge or opportunity emerging in that data. What was the signal? How did you investigate it further (what questions did you ask, who did you talk to)? What specific actions did you take as a result? And how did you use the data to measure the impact of those actions?"
This tests their ability to complete the Radar Loop – moving from observation to impact. Look for:
Pattern Recognition & Curiosity: Did they spot something subtle or early? Did they dig deeper than the surface?
Integrated Thinking: Did they combine the quantitative signal with qualitative context?
Action Orientation & Decision-Making: Did they formulate a plan and execute?
Accountability & Learning: Did they close the loop by measuring the outcome? Can they articulate what was learned?
Great answers are specific stories showcasing the full cycle. Don't hesitate to spend significant time here (even 20-30 minutes for a senior role), asking follow-up questions ("What other options did you consider?" "What was the hardest part?" "What would you do differently now?"). It's incredibly difficult to fake this level of detail convincingly. Could you confidently answer these two questions about your own recent work?
Conclusion: Leading with Honesty, Guided by Numbers
Let's circle back. Data-driven (or, more accurately, data-informed) leadership isn't about becoming a soulless automaton crunching numbers in a dark room. It's fundamentally about integrity and effectiveness. It's about having the discipline to seek the truth, even when it's uncomfortable, and the courage to act on that truth swiftly and decisively.
It’s about leveraging data not as a crutch, or as a tool for political maneuvering, but as an essential instrument for clearer perception – that sixth sense. It allows us, as leaders, to provide our teams with clear signals, foster rapid learning cycles, and build organizations that adapt and thrive because they stay relentlessly connected to reality. The best leaders internalize this approach until it becomes second nature – not what they do, but who they are.
The insights needed to unlock the next level of performance for your team or company are likely already available, hidden in plain sight within your data. The question is: will you commit to the discipline of the Radar Loop to uncover them?
What's one specific action you can take this week to strengthen your team's Radar Loop – perhaps refining one key metric, simplifying one report, or establishing one clear action trigger?
PS: This is a living document, constantly refined through my learnings and experience. Consider it a refined version of notes to myself instead of advice to others. 🙂